
Understanding how to use pandas for arithmetic, data alignment, and function application is key to unlocking insights from real-world datasets. In this blog, I share a comprehensive learning journey using real engineering data to explore the mechanical properties of materials—relevant for selecting components such as an Electric Vehicle (EV) chassis.
With over 25 solved problems, this blog combines theory with hands-on problem-solving using two datasets and practical engineering examples.
What This Project Covers
- Pandas Arithmetic & Data Alignment
- Function Application & Mapping
- Normalization, Classification, & Scoring
- Practical Engineering Data Transformation
Datasets Used
- Data.csv – A raw mechanical properties dataset with fields such as:
Su(Ultimate Strength),Sy(Yield Strength),E(Young’s Modulus),G,mu(Poisson’s ratio), andRo(density)- Contains missing values and inconsistencies
- material.csv – A cleaned, structured dataset with:
- Concatenated material labels
- Derived Boolean column (
Use) for classification based on strength/density thresholds
These datasets simulate a scenario where we need to assess and transform material properties for machine learning or engineering selection.
Real-World Engineering Context
In designing an EV chassis, engineers must consider strength-to-weight ratio, elasticity, and material stability. Using pandas, we:
- Calculate derived metrics like strength ratios and stiffness scores
- Classify materials based on thresholds
- Prepare data for potential ML models or decision trees
Problem Highlights and Solutions
Section 1: Arithmetic and Data Alignment
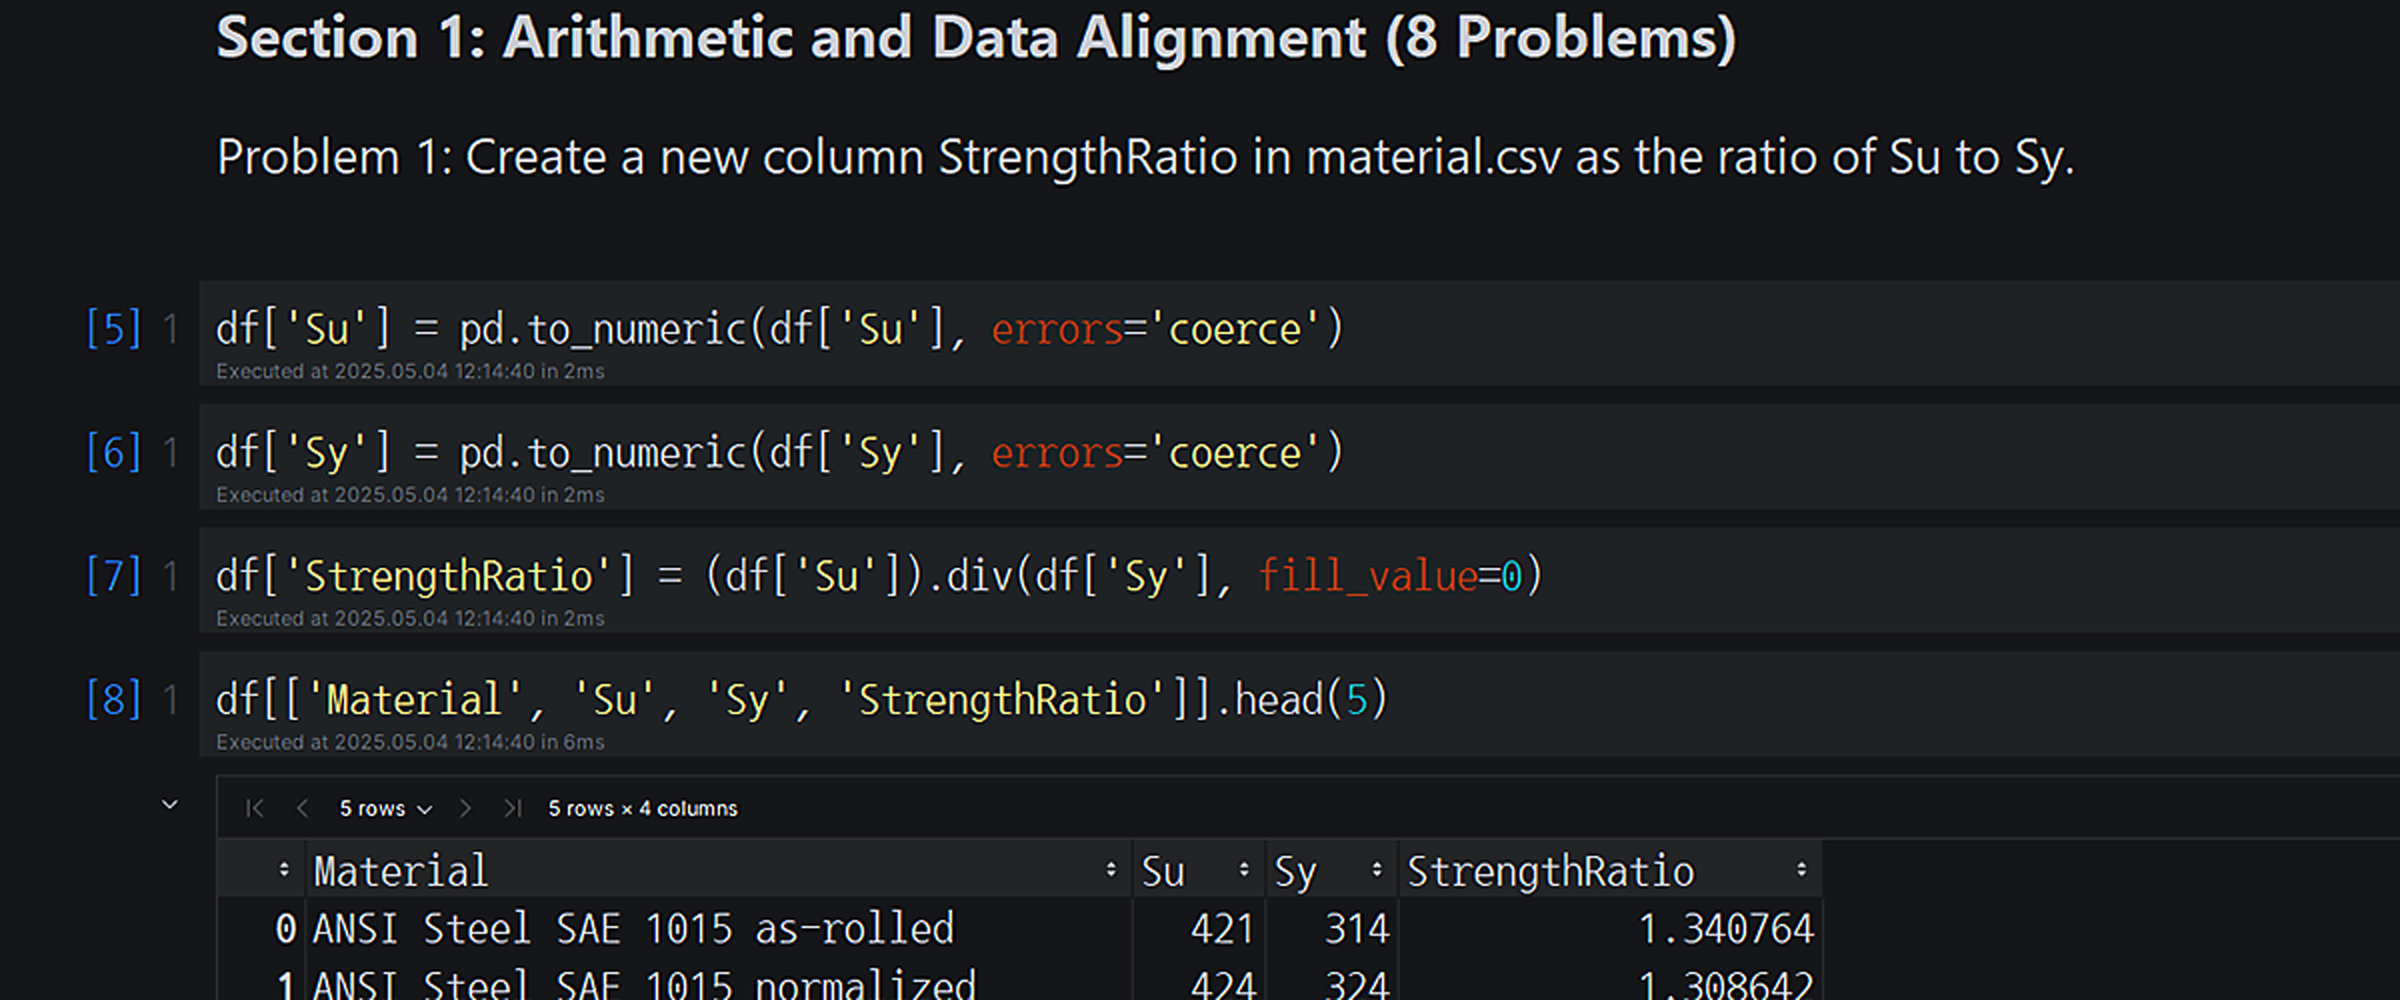
- Calculate
StrengthRatio = Su / Sy - Center data by subtracting column means
- Min-max normalize
E,G,Ro - Compute absolute pairwise differences using broadcasting
- Perform element-wise arithmetic with index alignment (
div(),sub(),rsub()) - Use
fill_value, broadcasting, and multi-column formulas (Strength_Index = (Su + Sy)/2)
Section 2: Function Application & Mapping
- Classify materials into
'Brittle','Moderate','Ductile'using.map() - Score each material’s total stiffness:
E + G + Ro - Apply custom classification based on quantiles (
Suinto ‘Low’, ‘Medium’, ‘High’) - Replace Boolean values with labels (
Suitable/Unsuitable) - Format floats using
.map()to 2 decimal places
Bonus Section: More Engineering Problems
- Element-wise division with mismatched index
- Subtract top 3 rows from bottom 3 rows using alignment
- Subtract medians from all values using broadcasting
- Create a custom material category like
'Fragile'based on compound condition:mu < 0.3 and Ro > 7000
Why This Blog is Useful
You’ll gain practical experience in:
- Preparing data for machine learning pipelines
- Applying alignment-aware operations on real-world numeric data
- Creating reusable functions to transform and evaluate datasets
- Understanding what matters when working with engineering-grade numerical data
This is especially helpful for:
- Engineering students working with simulation or materials data
- AI practitioners building models on sensor or mechanical data
- Anyone wanting to master pandas through meaningful examples
Preview of the Notebook
You can view the full notebook with all datasets, problems and solutions here:
📓 GitHub Repository
Let’s Connect!
If you enjoyed this and want more tutorials like it, follow me:
🎥 YouTube
👩💻 GitHub
💼 LinkedIn
📱 Instagram
📘 Facebook
Thanks so much for dropping by.