Introduction
In modern manufacturing, efficiency and precision are non-negotiable—especially in processes like injection molding, where minor deviations can cause costly defects or delays. That’s why smart analytics is no longer optional—it’s essential.
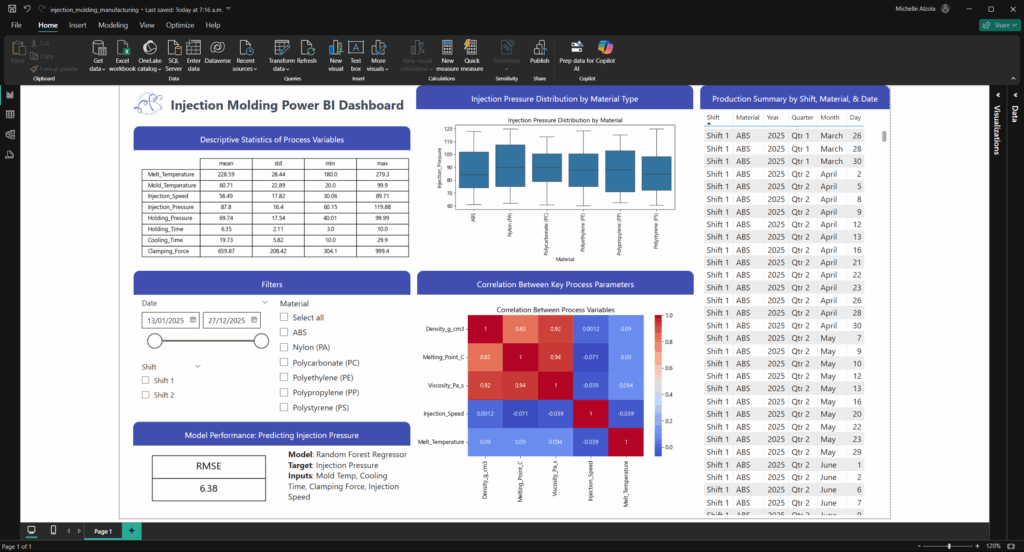
In this blog, we’ll explore how a purpose-built Power BI dashboard can transform raw production data into actionable insights. By integrating descriptive statistics, interactive filters, correlation matrices, and even machine learning predictions, this dashboard provides a 360° view of the injection molding process. It empowers engineers, operators, and decision-makers to monitor process variables, identify pressure trends by material type, and use predictive analytics to optimize performance.
Whether you’re part of a production team, a data analyst in manufacturing, or simply looking for inspiration for your next Power BI project, this case study demonstrates the practical power of data visualization and machine learning—together in one tool.
What This Dashboard Covers
Descriptive Statistics
Get quick insights into key process variables such as Melt Temperature, Mold Temperature, Injection Speed, and Pressure. Summary metrics (mean, std, min, max) help identify operational ranges and anomalies.
Interactive Filters
- Date Range Selector for temporal trend analysis
- Shift Toggle (Shift 1 / Shift 2) to compare workgroup performance
- Material Type Selector including ABS, Nylon (PA), Polycarbonate (PC), and others
Injection Pressure Distribution by Material
Using a boxplot, visualize how pressure varies depending on the material. This helps in choosing the right material for stability and repeatability.
Correlation Heatmap
Analyze the interdependence between variables like melt temperature, viscosity, and injection speed. The visual heatmap simplifies complexity and aids root-cause analysis.
Production Summary Table
Drill down into production records by Shift, Material, Year, Quarter, and Day. This supports audit trails and comparative review.
Predictive Model Performance
Using a Random Forest Regressor, the dashboard predicts Injection Pressure based on:
- Mold Temperature
- Cooling Time
- Clamping Force
- Injection Speed
Model RMSE: 6.38, offering a solid baseline for future process optimization.
Data & Architecture
The dashboard is powered by the following datasets:
Fact_Production.csv: Real-time measurements of molding parametersDim_Date.csv: Standard calendar dimensionDim_Shift.csv: Categorical shift mappingUpdated_Dim_Material.csv: Cleaned and categorized material types
All data is imported and transformed using Power BI’s Query Editor, ensuring a clean, connected model.
How to Reproduce This Dashboard
- Download Power BI Desktop (free).
- Clone or download the GitHub repo containing:
injection_molding_manufacturing.pbix- Required CSV data files
- Screenshot and documentation
- Open the PBIX file and refresh the data source links.
- Use the slicers and visuals to explore production dynamics and predictions.
Why This Matters
This dashboard is more than just visuals—it’s a decision-support system. By combining exploratory data analysis with predictive machine learning models, it closes the loop between monitoring, diagnosis, and prevention.
In real-world use cases, this could:
- Reduce scrap rates
- Optimize cycle times
- Identify faulty settings before defects occur
- Enhance operator training with data-driven feedback
Final Thoughts
Power BI’s ability to integrate Python models, visualize multidimensional data, and provide real-time filtering makes it a powerhouse for manufacturing analytics. If your organization deals with process-heavy operations like injection molding, adopting a dashboard like this could be a game-changer.
For developers, this project is also a great portfolio piece—showcasing your ability to combine ETL, visualization, and data science in one complete solution.
Let’s Connect!
🎥 YouTube
👩💻 GitHub
💼 LinkedIn
📱 Instagram
📘 Facebook
Thanks so much for dropping by.