Overview
This blog dives into exploratory data analysis (EDA) using Pandas on a real-world manufacturing dataset from a continuous casting process. Covering descriptive statistics, correlation and covariance, ranking, and rolling analysis, this post is designed to help analysts, engineers, and data scientists understand how to use Pandas tools to generate meaningful process insights.
Dataset:
ccm_rul_dataset.csv
Industry: Steel Manufacturing (Continuous Casting)
Focus: RUL (Remaining Useful Life), composition percentages, temperature, speed, and weight.
What You’ll Learn
- How to profile large manufacturing datasets using summary statistics.
- Ways to detect outliers, patterns, and process drifts.
- How correlation and covariance reveal variable relationships.
- Why ranking, percent changes, and rolling means help in production monitoring.
- How missing data impacts analysis—and what to do about it.
Descriptive Statistics That Reveal the Hidden Story
Steel Weight (steel_weight, tonn)
- Mean ≈ 163.94
- Median ≈ 163.30
- IQR ≈ 6.22
Suggests a symmetric and consistent distribution.
RUL Range
- Over 8.47 million → Huge spread in lifespan values.
May indicate outliers or long historical tracking.
Technical Trim (technical_trim, tonn)
- Only 76 valid records (0.43%)
Sparse column; unreliable for modeling, but great for triggering binary quality control events.
Outliers and Extremes
Max Temperature (temperature_measurement1)
- Occurred on 2020-01-05
- Can indicate critical process moments or thermal stress.
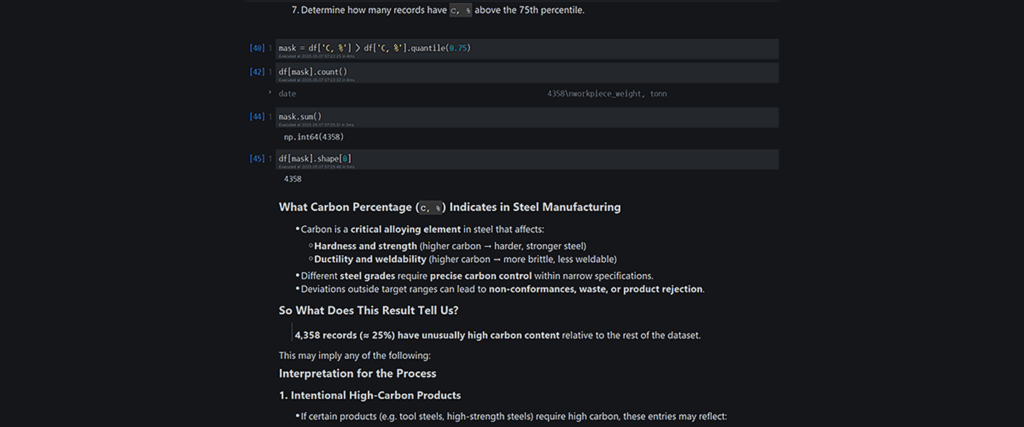
High C, % (Carbon Content)
- Top 25% → 4,358 records
Might reflect specialty steels, or risk non-compliance if unintentional.
Outlier Detection with IQR
- Manganese (
Mn, %) IQR ≈ 0.48
Shows tight control, ideal for consistent steel quality.
Value Counts and Membership
steel_type
- 12 unique types
Arm500,St3sp, and1015dominate → Ideal for focused analysis.
alloy_type
- 99% are
opensystems - Only 1%
closealloying → used in precision-critical products.
doc_requirement == 'T1'
- Not found — possibly a mistaken label or unused spec.
Ranking for Insights
RUL Rankings
- Top performers:
Arm500,1015 - Repeated ties → resolved using
"average"and"first"ranking methods.
Operational Insight
Batches with top RUL likely underwent optimal processing conditions, like better casting speed, uniform temperatures, or effective alloying.
Changes Over Time: Percent Change, Differences & Rolling Windows
Percent Change in steel_weight, tonn
- Detects large deviations (>10%) → suggests process shifts, manual changes, or batch transitions.
Biggest Drop in RUL
- Nearly -100% drops in May–June 2020
Indicates sudden degradation or critical failure, likely linked to equipment or sensor faults.
Rolling and Expanding Means
- 5-point rolling mean of RUL: Smooths noise; ideal for trend detection.
- Expanding mean of temperature: Tracks stabilization or process drift over time.
Correlation and Covariance
Pearson Correlation
- RUL vs. Temperature → ~0.005
No linear relationship → explore nonlinear interactions.
Chemical Composition Correlations
Ti, %andCe, %: strong (≈ 0.81)S, %: weak correlations → likely an independent variable.
Covariance
RUL⬆ withalloy_speedRUL⬇ withswing_frequency
Useful for identifying variable influence direction in modeling.
Dealing with Missing Data
Key Observations
technical_trimandresiduals_grab2→ over 90% missingsteel_weightandalloy_speed→ complete
Strategies
- Drop highly incomplete columns.
- Impute with
mean(),median(), orfillna(). - Use flags like
was_trimmed = df['technical_trim, tonn'].notna().astype(int)
Group-Based Summary Stats
Group by steel_type → avg RUL
1015: highest RULArm240: lowest
Use this to optimize material selection and predict reliability.
Group by num_crystallizer → std of alloy speed
- Crystallizer 3 & 5 → higher variation → investigate
Final Takeaways
| Insight Type | Meaning |
|---|---|
| Symmetric distribution in steel weight | Stable process |
| High carbon in 25% of data | Specialized alloys or process drift |
| Sudden RUL drops | Possible failures or batch issues |
| Open vs Close alloying | Process control vs precision |
| Ranking RUL | Highlights optimal configurations |
| Rolling stats | Reveal trends, reduce noise |
| Missing data | Must be handled before modeling |
Ready to Learn From Code?
Access the full notebook and source code here:
🔗 GitHub Repo
Let’s Connect!
If you enjoyed this and want more tutorials like it, follow me:
🎥 YouTube
👩💻 GitHub
💼 LinkedIn
📱 Instagram
📘 Facebook
Thanks so much for dropping by.