Project Description
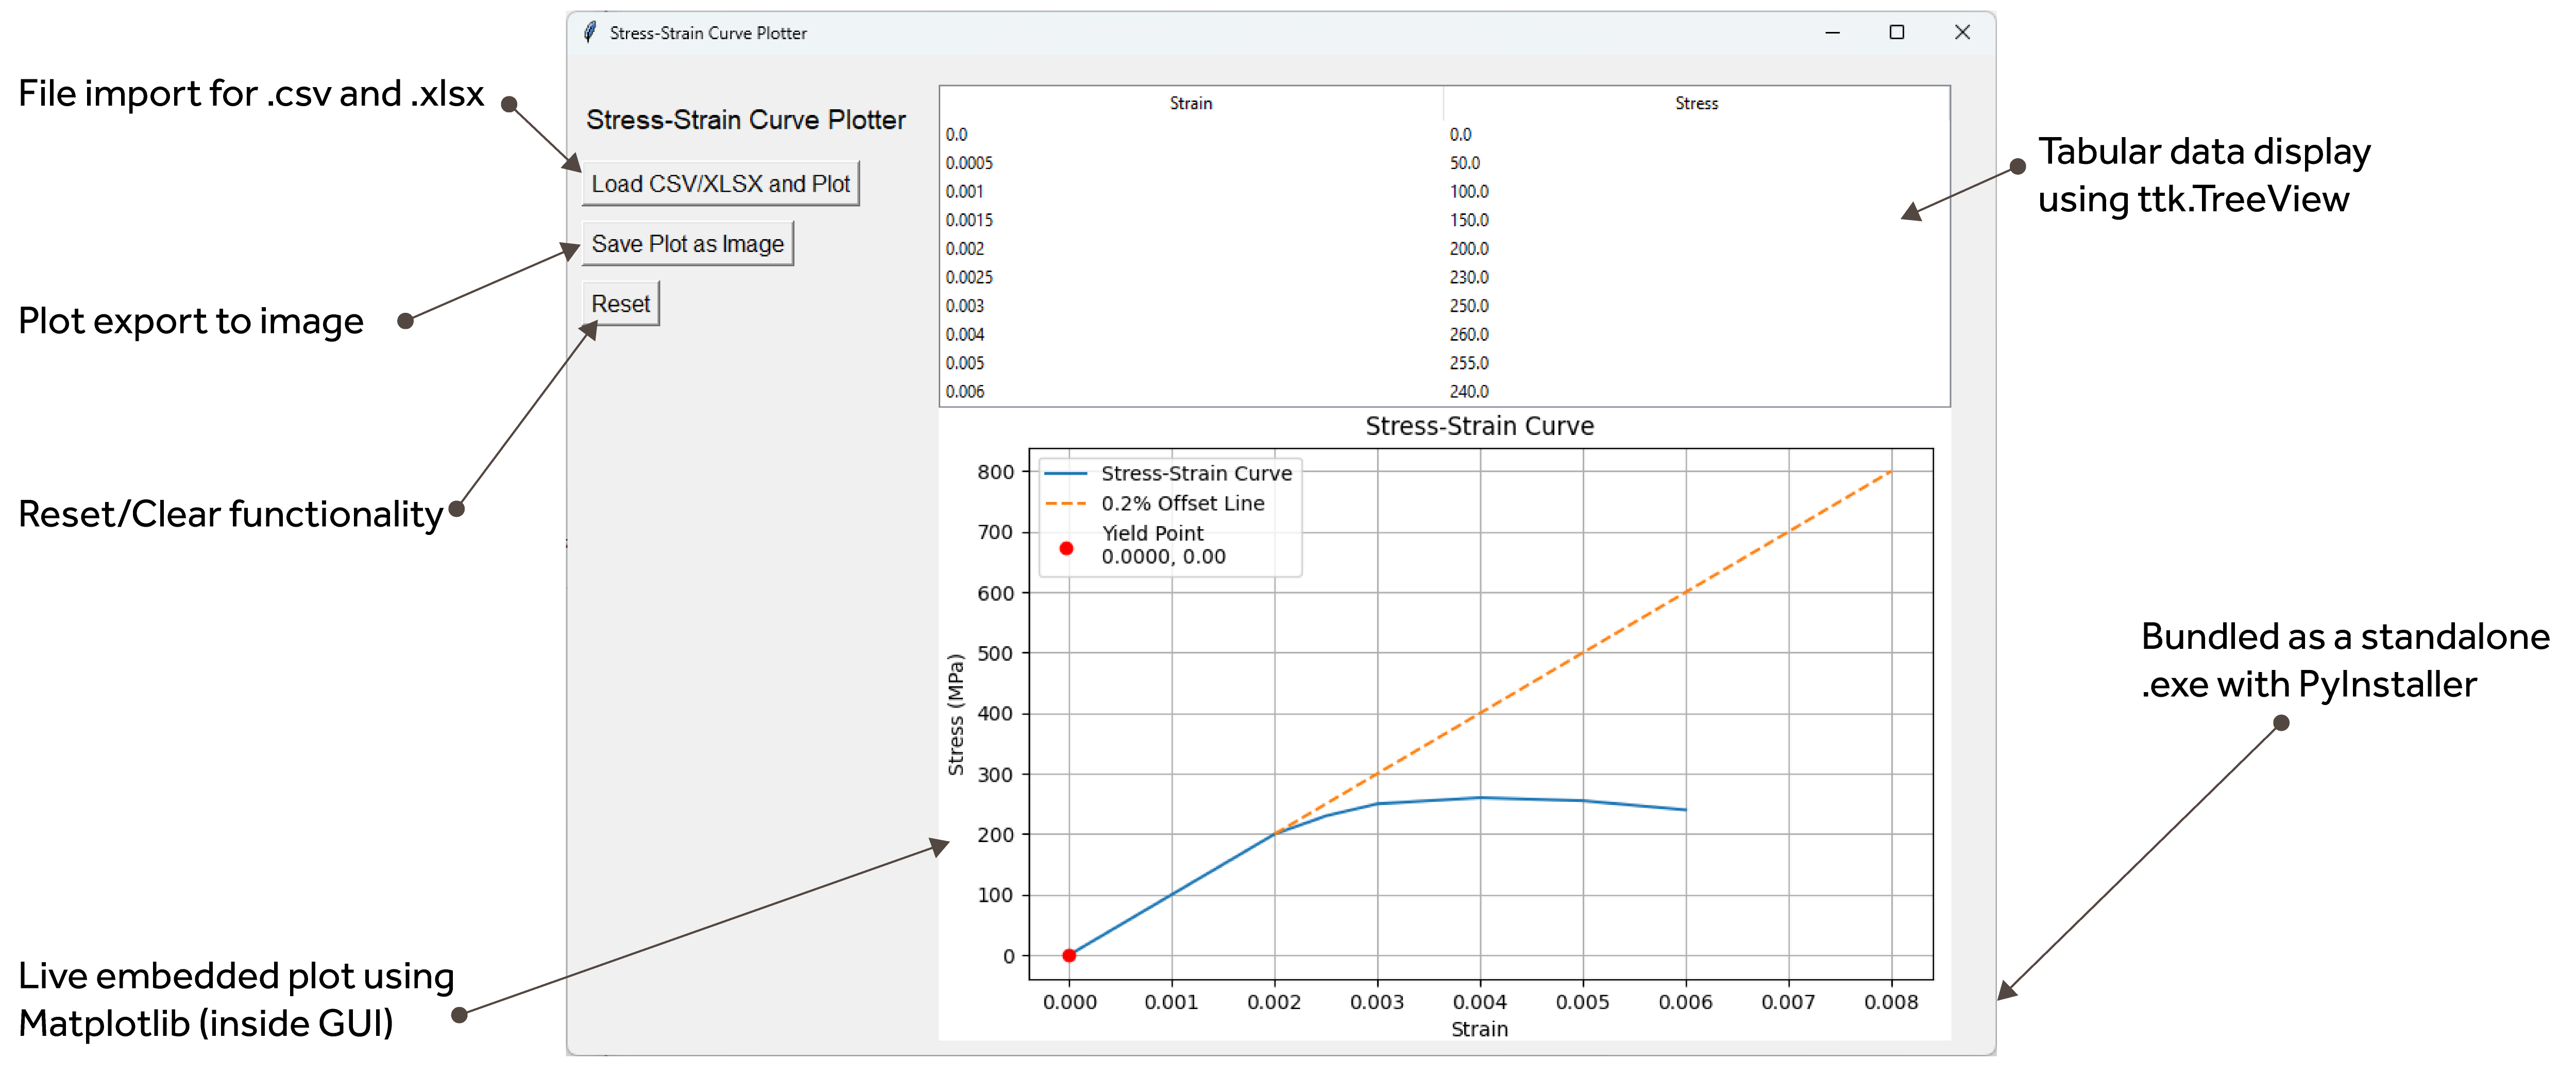
A standalone Python desktop application that reads material data from CSV or Excel files and generates a stress-strain curve. It computes key mechanical properties such as Young’s Modulus, Yield Strength (using 0.2% offset method), and Ultimate Strength. Built using Tkinter, Matplotlib, Pandas, and NumPy, this tool is intended for engineers, researchers, or students analyzing material behavior.
1. Young’s Modulus (Elastic Modulus)
Definition:
Young’s Modulus is the slope of the initial, linear portion of the stress-strain curve. It quantifies stiffness — how much a material resists deformation under stress.
How the app calculates it:
- Takes the linear region of the data (commonly up to 0.2% strain)
- Applies linear regression to compute the slope
- Formula used: E=Δσ/Δε
Engineering Insight:
High Young’s Modulus → Stiff material (e.g., steel)
Low Young’s Modulus → Flexible material (e.g., rubber)
Code Location:
linear_region = strain <= 0.002
youngs_modulus = np.polyfit(strain[linear_region], stress[linear_region], 1)[0]
Explanation:
strain <= 0.002: selects the linear (elastic) region.np.polyfit(..., 1)[0]: performs linear regression and returns the slope, which is Young’s Modulus.
Where it is used in the app:
Used later to draw the offset line for computing yield strength.
2. Yield Strength (Using 0.2% Offset Method)
Definition:
Yield Strength is the stress at which permanent (plastic) deformation begins. It marks the transition from elastic to plastic behavior.
Why the 0.2% Offset Method?
- Some materials (like metals) do not have a clear “yield point”
- The 0.2% offset method is a standard engineering practice:
Draw a line parallel to the elastic slope, offset by 0.002 strain (0.2%)
How the app calculates it:
- Computes the offset line using Young’s Modulus
- Finds the intersection point between the curve and offset line
- That intersection point gives:
- Yield Stress
- Corresponding Strain
Engineering Insight:
This value is crucial in designing components that should not undergo permanent deformation under regular use.
Code Location:
offset_strain = strain + 0.002
offset_line = youngs_modulus * offset_strain
diff = np.abs(stress - offset_line)
yield_index = np.argmin(diff)
yield_stress = stress[yield_index]
yield_strain = strain[yield_index]
Explanation:
offset_strain = strain + 0.002: creates a new strain line, offset by 0.2%offset_line = youngs_modulus * offset_strain: calculates the offset line using the elastic slopenp.abs(stress - offset_line): calculates how far each point is from that linenp.argmin(diff): finds the index where the stress curve is closest to the offset lineyield_stressandyield_strain: give the yield point
Where it is used in the app:
- Plotted on the graph as a red dot
- Displayed in the result message:
f"Yield Strength: {yield_stress:.2f} MPa at Strain: {yield_strain:.4f}"Ultimate Tensile Strength (UTS)
Definition:
The maximum stress that the material can withstand before necking or failure.
How the app calculates it:
- Simply finds the maximum value in the stress array
Engineering Insight:
A measure of the material’s peak strength. Design for UTS is common in failure analysis, but in safety-critical applications, engineers design well below this value.
Code Location:
ultimate_strength = np.max(stress)Explanation:
- Finds the maximum stress value in the dataset.
- This is the peak of the stress-strain curve before fracture or necking.
Where it is used in the app:
Displayed in the result pop-up message:
f"Ultimate Strength: {ultimate_strength:.2f} MPa"Summary Table
| Property | What It Measures | How It’s Calculated | Importance |
|---|---|---|---|
| Young’s Modulus | Stiffness (elastic slope) | Slope of initial curve | Structural rigidity |
| Yield Strength | Onset of permanent deformation | 0.2% offset method | Design limit for elastic behavior |
| UTS | Max stress before failure | Max value of stress | Peak strength before necking |
Graphical Plot Code (Where the Properties Are Visualized)
fig, ax = plt.subplots(figsize=(6, 4))
ax.plot(strain, stress, label='Stress-Strain Curve')  # Full curve
ax.plot(offset_strain, offset_line, '--', label='0.2% Offset Line')  # For yield
ax.plot(yield_strain, yield_stress, 'ro', label=f'Yield Point\n({yield_strain:.4f}, {yield_stress:.2f})')
In Summary – Key Code Lines
| Property | Key Line(s) |
|---|---|
| Young’s Modulus | youngs_modulus = np.polyfit(strain[linear_region], stress[linear_region], 1)[0] |
| Ultimate Strength | ultimate_strength = np.max(stress) |
| Yield Strength | Series of lines using offset line logic and np.argmin(diff) |
Key Features of the App
Tools and Technologies
| Tool | Purpose |
|---|---|
| Python | Main language |
| Tkinter | GUI development |
| Matplotlib | Plotting charts |
| Pandas | Data loading and manipulation |
| NumPy | Numerical calculations |
| OpenPyXL | Excel file support |
| PyInstaller | Packaging as .exe |
My Reflection
This project helped me improve my understanding of file handling, GUI layout management, and numerical methods in mechanical engineering. I also learned how to bundle applications with PyInstaller and troubleshoot real-world deployment issues like missing dependencies.